By Logan Thrasher Collins
Click here for draft of a small-scale ExxRM proof-of-concept experimental protocol
Supplemental MATLAB code is located at the end of this page before the references
Combining synchrotron x-ray microscopy with expansion microscopy may represent a feasible approach for whole human brain connectomics at the nanoscale. Synchrotron x-ray microtomography on its own provides extremely fast imaging at high resolution, yet necessary tradeoffs between imaging throughput and resolution mean that the imaging an entire human brain with voxel sizes of less than 30 nm may still take much too long with current synchrotron technology. Fast imaging with voxel sizes of 300 nm is much more readily achievable. Furthermore, expansion microscopy isotropically enlarges tissue by infusion of a swellable hydrogel, facilitating resolution increases. The combination of x-ray microtomography and expansion microscopy (hereafter referred to as ExxRM) could thus push the effective voxel size down to the level needed for dense connectomics. However, because tissue volume and imaging time scale cubically with expansion factor, careful balance between design of the synchrotron x-ray optical setup and the degree of expansion will be needed. In particular, large high-resolution detectors will be vital. Additionally, methods to compensate for signal dilution from expansion and to stabilize expanded tissue under brilliant x-rays will be crucial. In this perspective, I will explore balances between synchrotron optical engineering choices and expansion factor, propose methods to successfully implement ExxRM in the context of human brains, and estimate how much it would cost to image the human brain in this way. Imaging brains via ExxRM may represent a crucial paradigm shift in connectomics which paves the way for holistic understanding of human brain function.
Introduction
Nanoscale connectomic imaging of the entire human brain represents a long sought-after goal that could provide the foundation for dramatic advances in neurobiology, neurotechnology, and artificial intelligence.1,2 Currently, the leading method for nanoscale connectomics is volume electron microscopy (EM). But imaging a 1 mm3 volume of mouse cortex over a period of 6 months required a tremendous collaborative effort by Yin et al. to develop a parallelized and fully automated transmission electron microscopy (TEM) system consisting of six instruments working in parallel.3 Each of these six instruments cost $125,000. The mouse brain has a volume of roughly 500 mm3, meaning that if these numbers were directly scaled, the process would take 250 years.4 That said, Yin et al.’s TEM dataset had high resolution with 4×4×40 nm voxels, so throughput might be increased by imaging at somewhat lower resolution. As such, it is conceivable to argue that advances in EM technology may enable imaging of an entire mouse brain over the course of a few years. EM therefore represents a viable option for mouse brain connectomics. But the human brain’s volume is roughly 1200 cm3, around 2400-fold larger than the mouse brain.5 Even if EM technology somehow advances to the point where an entire mouse brain can be imaged in a single year for $10M, mapping a human brain with comparable parameters would take thousands of years. In my view, this provides a strong argument for the idea that a radically different approach is necessary for dense human brain connectomics and perhaps for dense connectomics in general.
Expansion light-sheet fluorescence microscopy (ExLSFM) represents a promising alternative to EM, yet this modality also falls short when considering the volume of the human brain (particularly after expansion). For instance, Lillvis et al. utilized 8-fold expansion and lattice light-sheet microscopy (ExLLSM) to image the Drosophila central complex in three colors with approximately 15×15×50 nm (including gain from expansion) voxels over the course of 5 days.6 But even accounting for the 8-fold expansion (512-fold volume increase), this amounts to a volume of less than 0.5 mm3. Imaging an 8-fold expanded mouse brain assuming these numbers would take 7009 years. Lattice light-sheet microscopes typically cost a few hundred thousand dollars each7 and might be parallelized enough to image an entire mouse brain within a year, particularly if further hardware optimization is achievable. Yet the 2400-fold larger volume of the human brain relative to the mouse brain indicates that ExLLSM human brain connectomics may still lay out of reach. Though some investigators have made strides in combining neuronal barcoding and ExLSFM and thus might be able to image at lower resolution, allowing human brain connectomics in a reasonable time frame through parallelization of thousands of light sheet microscopes instead of tens of thousands or more, there is still room for circumventing such expensive brute-force approaches. New methods are needed to facilitate faster dense human brain connectomics.
I suggest that a radically different strategy is needed to put the goal of human brain connectomics within reasonably close reach. Uniting synchrotron x-ray microtomography (XRM) (Figure 1A-B), expansion microscopy (ExM), and a recent staining method known as Unclearing Microscopy8 may facilitate ExxRM imaging of the human brain at sub-30 nm voxel size on timescales of around 1 year for a cost of around $10M. Success of this approach will necessitate overcoming some technical hurdles, yet I am optimistic that these particular challenges can be conquered. ExxRM may represent a feasible platform to acquire images suitable for dense connectomics across entire human brains.

Figure 1 Principles of synchrotron XRM. (A) Synchrotrons generate electrons from a source, propel them through a linear accelerator (linac), raise their energy in a booster ring, and then keep the electrons circulating for long periods of time at relativistic speeds in the storage ring. As relativistic electrons move along a curved path controlled by bending magnets, they emit brilliant x-ray beams in the direction tangent to the curve in the direction of the electron movement. Insertion devices that inject the x-rays into beamlines are placed at straight sections of the synchrotron ring. These insertion devices stimulate emission of bright and coherent beams into the experimental stations. (B) Microtomography beamlines receive an x-ray beam from an insertion device and filter out a narrow band of wavelengths using a monochromator. The beam passes through a sample on a rotating tomography stage that can be positionally adjusted to change the location of the field of view (FOV) within the sample. Projection images are taken across 360° of rotation. X-rays passing through the sample are converted to visible light using a scintillator, then directed by mirrors to a lens system that magnifies the image. This light hits a detector camera and data is recorded for 3D reconstruction.
Recommended methodologies for ExxRM
ExxRM’s success will require developing methodological strategies to mitigate technical challenges. Obtaining sufficient contrast to resolve subcellular features will be vital. ExM cubically dilutes the amount of cellular material per unit volume, so creative staining techniques will be needed. Approaches that ensure stability of expanded tissues under brilliant x-ray illumination for long durations will also be crucial. Multicolor imaging would greatly benefit the usefulness of whole brain connectomics data, so ways of efficiently obtaining tomograms in multiple colors are needed. These challenges must be conquered to translate ExxRM.
A central engineering hurdle for ExxRM is attaining sufficient feature contrast for capture of clear images. Because expanded tissues experience cubic dilution of target biomolecules, contrast from traditional stains such as osmium tetroxide almost entirely vanishes during x-ray microtomographic imaging (Collins et al., unpublished data). An elegant solution to this problem has come in the form of a recently developed technique called Unclearing Microscopy.8 For this technique, M’Saad et al. biotinylated primary amines (found on proteins, phosphatidylethanolamine lipids, etc.) throughout expanded samples, treated the sample with streptavidin horseradish peroxidase (streptavidin-HRP) fusion protein, and then stained with ionic silver reagents (from the EnzMet™ HRP Detection Kit) or with 3’3-diaminobenzidine (DAB). This triggered enzymatic deposition of enough chromogenic silver or DAB to make 20-fold expanded HeLa cells visible to the naked eye despite their 8000-fold increase in volume relative to the unexpanded state. Phase contrast light microscopy subsequently revealed subcellular features such as mitochondrial cristae, nuclear pore complexes, and nuclear membrane. Unclearing thus facilitates physical reconstruction of the structures that are pulled apart by ExM, filling in the gaps left by the expansion process (Figure 2A-B). Silver stain Unclearing could enable either absorption XRM or phase contrast XRM of expanded tissues since silver has excellent x-ray attenuation index β at relevant beam energies as well as excellent x-ray phase decrement δ. Focusing on phase contrast XRM may represent a better option since it can decrease the necessary dose of radiation per unit time by using x-ray wavelengths which are not absorbed as strongly by the tissue. Furthermore, phase contrast XRM is most sensitive to differences in sample density9 and silver staining forms dense precipitates of metallic silver (which in pure form has a high density of 10.49 g/cm3), so this approach might provide superior contrast in the context of ExxRM. Here, ExM’s sample dilution might prove advantageous because it could generate strongly distinct densities between silver-stained cellular features and the rest of the stabilized hydrogel. It should be noted that, for phase contrast XRM, the previously mentioned stabilization approach would need to fill the space between cellular features with a substance that differs substantially in density from the silver (or similar stain). Combining Unclearing Microscopy with phase contrast XRM could provide excellent feature contrast for ExxRM connectomics.
Expanded tissues are known for their fragility and synchrotron x-rays are known for their harshness, so strategies for solving the problem of sample degradation are needed. Newer expansion recipes which use high monomer concentrations have displayed substantially greater physical sturdiness than earlier generations of ExM hydrogels,10,11 so this may aid in stabilization to some degree. Yet additional advances in ExM sample preparation may still be necessary due to high required fluxes and long imaging times. Cutting human brain samples into smaller volumes on the order of a few centimeters may improve the situation by decreasing imaging times per sample. Keeping the sample at cryogenic temperatures with the help of cryoprotectants to prevent ice crystals damaging the tissue may also help since heat generation from the x-rays is particularly problematic for hydrated samples.12,13 That said, low temperatures would not fix the issue of radiation damage from ionization, so this issue should still be considered.14 Further stabilization might come in the form of infusion of a rapidly crosslinkable or crystalizing substance which irreversibly locks all biomolecules into place (Figure 2A-B). Polar uncharged fixatives such as glycol methacrylate may serve this purpose since they likely could substitute for water to facilitate expansion (Collins and Kohman, personal correspondence). Regardless of the specific reagents, it should be stated that the chosen substance would need to undergo an inducible crosslinking reaction that does not cause distortion of the expanded tissue. The chosen substance would need to undergo an inducible crosslinking or crystallization reaction that does not cause distortion of the expanded tissue, to not shrink or distort the expanded tissue while it diffuses into the hydrogel, and to minimally absorb x-rays at the energy range used for imaging, and to contrast sharply with the chosen stain material. So, the phase decrement of the stabilizing substance should be similar or lower compared to amorphous ice. This approach may enable sufficient stabilization to prevent nanoscale tissue degradation even with exposure to extremely brilliant synchrotron x-rays.
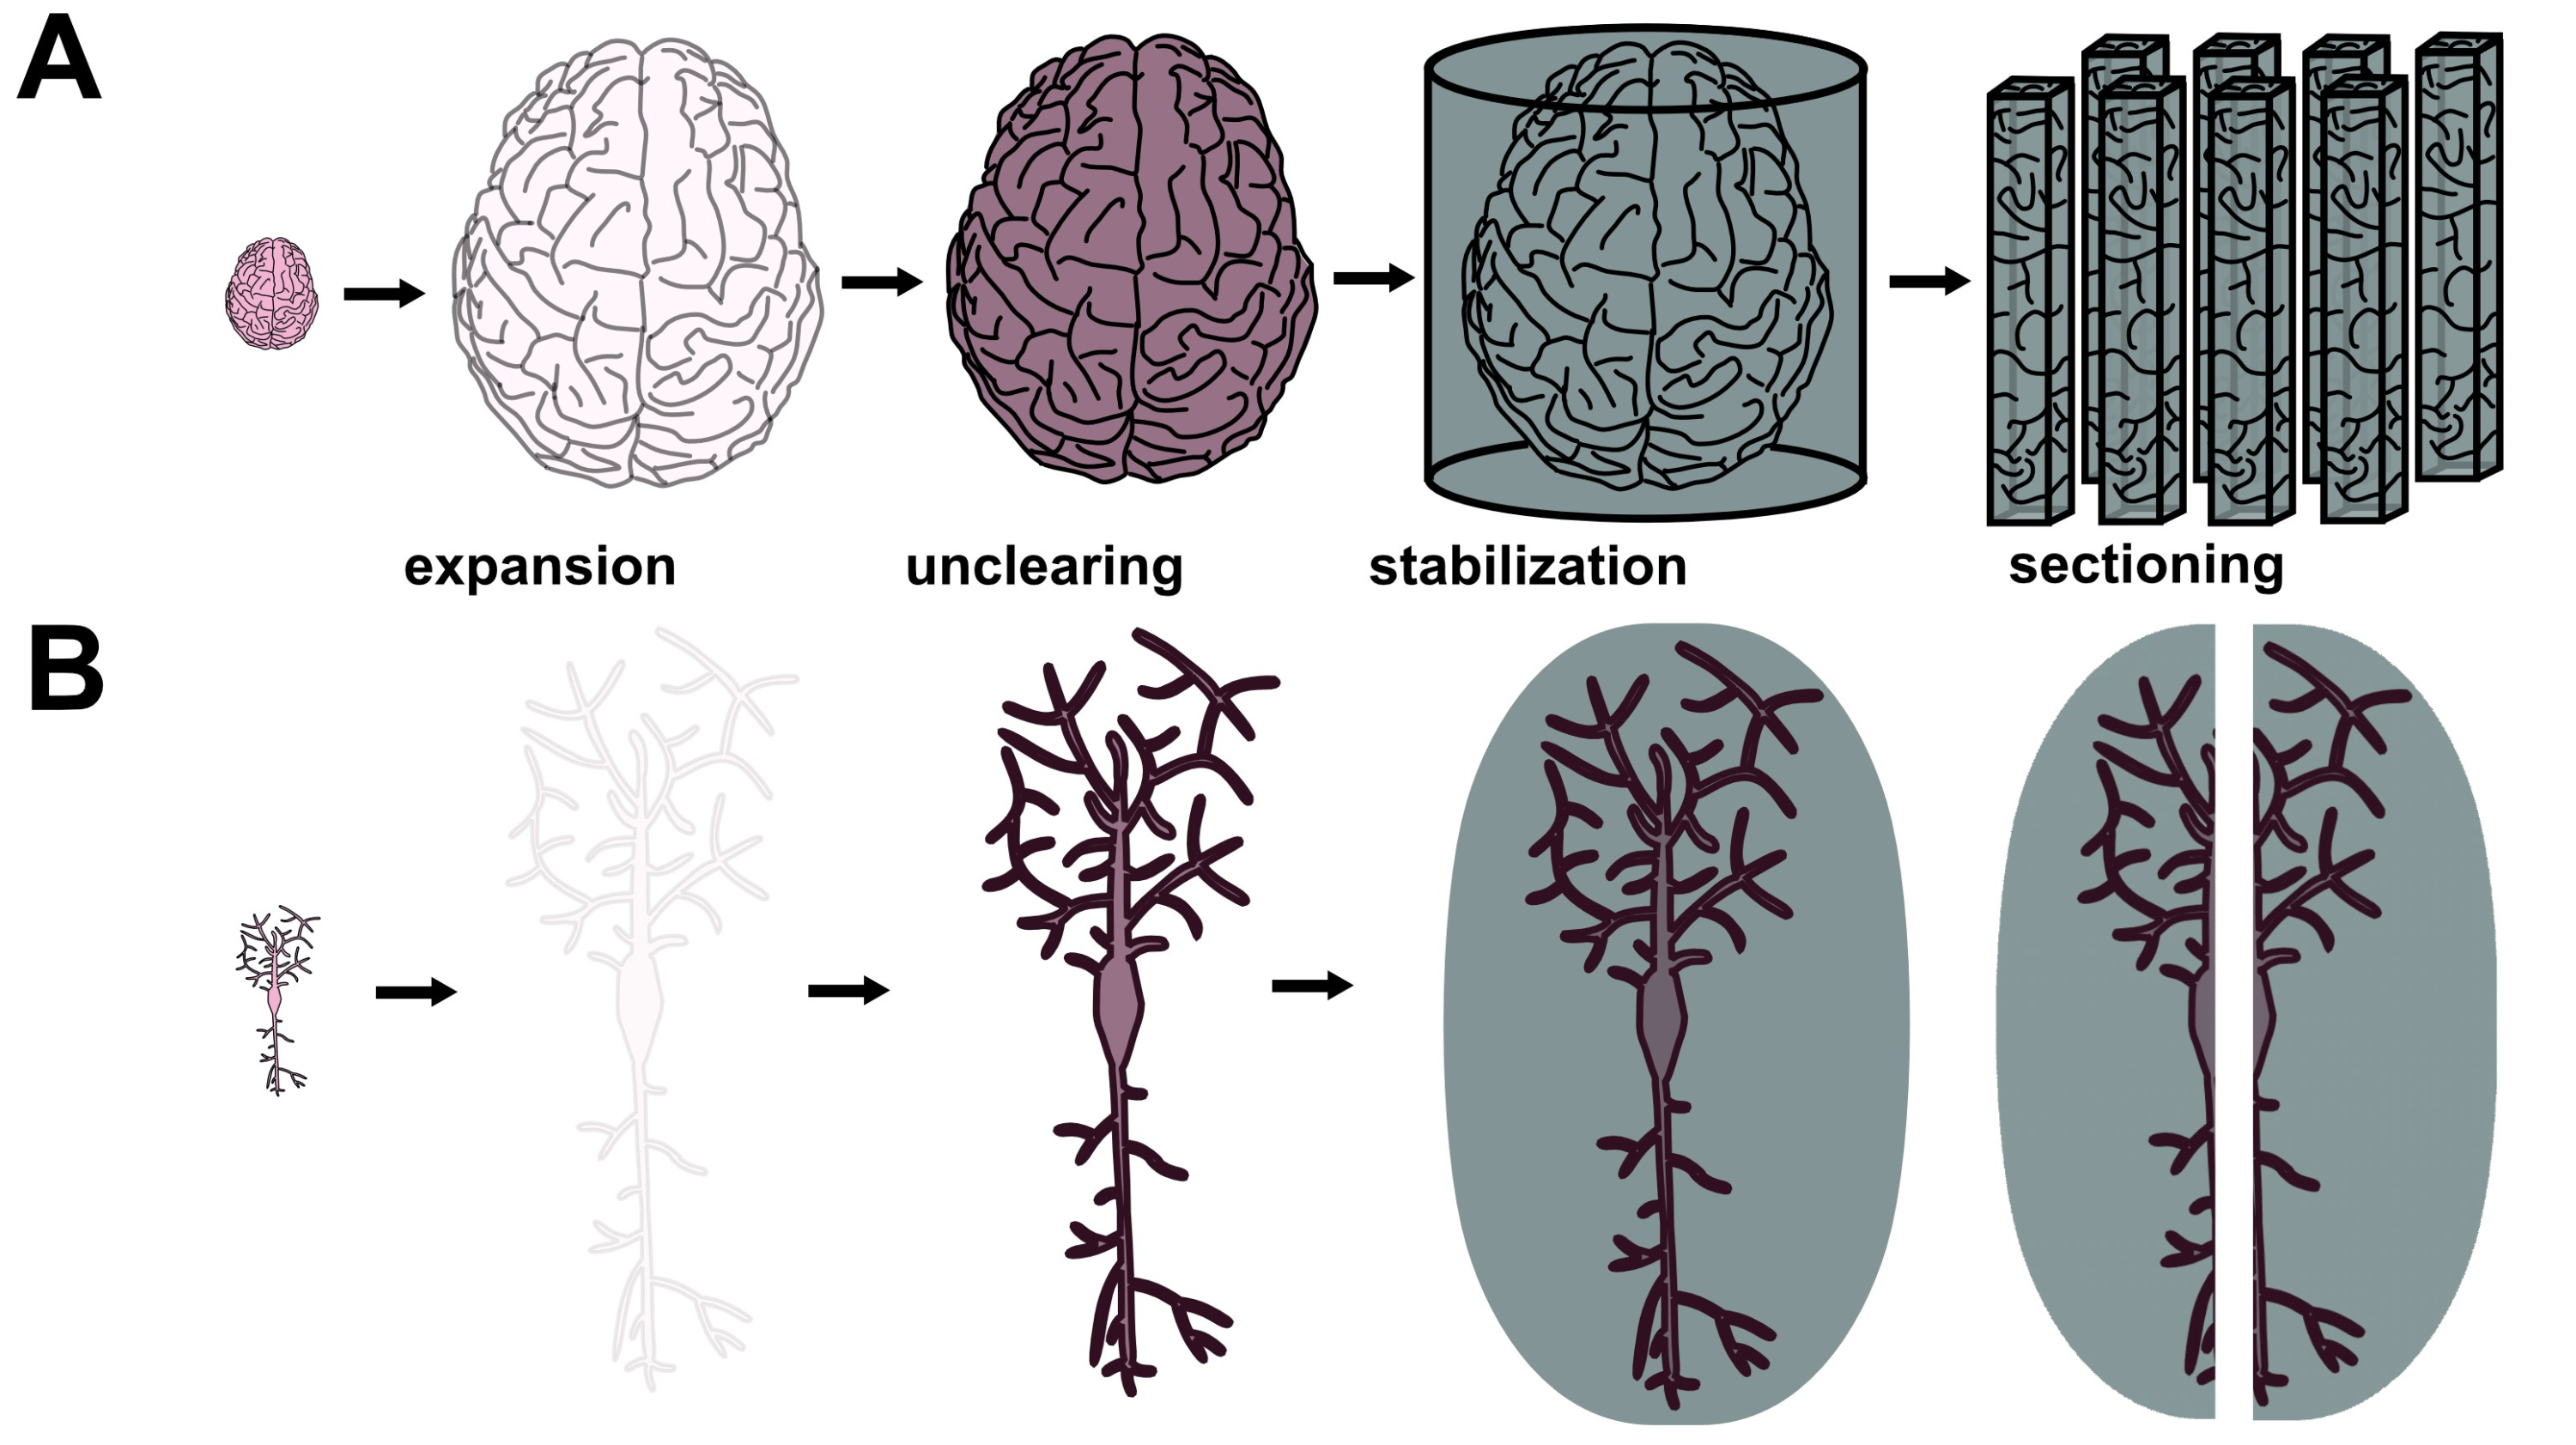
Figure 2 Proposed sample preparation technique for ExxRM. (A) Macroscale view of a human brain undergoing expansion, Unclearing, and stabilization. (B) Nanoscale view of a neuron within the brain undergoing expansion, Unclearing, and stabilization. Considerable amplification of signal density after Unclearing should occur.
Multicolor ExxRM would greatly enhance the value of acquired image data since synapses and key biomolecules could then be tagged within the 3D reconstruction.15,16 Fortunately, multicolor absorption x-ray microscopy represents an established technique wherein two or more staining materials undergo two or more rounds of imaging at beam energies corresponding to the absorption edges of the chosen materials. The absorption edges in question must be sufficiently distinct that minimal overlap in detection occurs across the different beam energy imaging rounds. As an example, Depannemaecker et al. employed this approach by using antibody-linked gold nanoparticles to mark neuronal nuclei in mouse brains while also staining neurons with silver via Golgi’s method.15 They imaged at a beam energy corresponding to an absorption edge of silver and at a beam energy corresponding to an absorption of gold. In addition, multicolor phase contrast x-ray imaging might be accomplished by using molecularly targeted tags with distinct densities relative to the Unclearing silver stain. For instance, gold has a density about twice that of silver, so it might be possible to segment gold nanoparticles after data acquisition. A potential challenge for these methods comes from the difficulty of inducing reliable diffusion of large metallic nanoparticles into tissue. That said, post-expansion pre-stabilization staining could help overcome the problem since expanded gels are typically more porous than pre-expansion tissue. Multicolor ExxRM in 2-3 colors should be achievable, opening doors to more useful whole-brain image datasets.
Though some trial and error will doubtless prove necessary for ExxRM optimization, the required technologies lay within fairly close reach. High contrast could be achieved by applying Unclearing Microscopy to counter signal dilution from expansion. Stability under brilliant x-rays may be possible by leveraging stabler expansion recipes with higher monomer concentrations, by cutting the brain into centimeter-scale subvolumes to decrease radiation dose per sample, by employing cryogenic temperatures during imaging, and by developing rigidity-enhancing materials to infuse into expanded gels. Multicolor ExxRM could be achieved by staining with metallic nanoparticles linked to affinity reagents and performing additional scans tuned to the absorption edges of the chosen metals. These directions may provide a path towards successful ExxRM.
How fast can synchrotrons image expanded brains?
Synchrotron facilities offer bright and coherent x-rays that can rapidly image large volumes of tissue at high resolutions (Figure 1A-B). In this regard, a recent international connectomics consortium known as SYNAPSE (Synchrotrons for Neuroscience: an Asia-Pacific Scientific Enterprise) has highlighted the value of synchrotron XRM for imaging large animal brains.17 Unfortunately, SYNAPSE does not employ ExM and is thus limited to 300 nm resolution, making their connectomics approach unsuitable for dense reconstruction of neuronal connections. At this resolution, they can only roughly reconstruct neuronal projections and certainly cannot identify synapses. Nonetheless, SYNAPSE has made technical strides towards optimizing the engineering of synchrotron beamlines towards whole-brain imaging applications. In particular, they report acquiring x-ray projection images in as little as 1 millisecond by utilizing a high-photon-energy cut-off mirror and certain filters in place of a monochromator (and “white” radiation is employed).17,18 Based on the Crowther limit,12 the number of projections Nθ needed to completely reconstruct a single tomogram is described by the equation Nθ = (π/2)N where N is the number of pixels along the horizontal direction of the image. So, for an image with N = 1000, the tomogram will require up to 3142 projection images. If each projection takes 1 ms to acquire, this means that one could potentially obtain such a tomogram in just over 3 seconds. Importantly, one should realize that larger tomograms will overall increase imaging speed despite necessitating more projections since the tomogram size scales volumetrically and the projection number only scales linearly. So, the largest possible detectors should be utilized given engineering constraints (described in next paragraph). With these metrics, one can calculate whether synchrotron microtomography might image entire expanded brains and help determine what expansion factor to use for reaching sub-30 nm voxel size while still imaging over reasonable timeframes.
Given the information described above, one may estimate optimal parameters for ExxRM (Table 1, Supplemental Code File 1). To achieve sub-30 nm pixel size, a recently developed form of ExM known as “Magnify”, which features lipid and protein retention, high physical stability, and 11-fold expansion of brain tissue may represent an ideal technique.10 At 11-fold expansion and 300 nm pixel size, effective voxel size would reach 27 nm, sufficient for dense connectomics. To image rapidly enough to acquire the entire human brain in one year, tradeoffs between detector size and pixel size must be considered. Synchrotron XRM typically uses a scintillator to convert x-rays into visible light prior to magnification via a visible light objective lens, which means the field of view (FOV) is limited by this objective lens and by how many sufficiently small pixels can be packed onto a detector. Generally, the lower the magnification of the objective lens, the wider its FOV. Yakovlev et al. demonstrated a technical accomplishment showing the feasibility of combining large FOV with high resolution.19 They developed a custom objective lens with a magnification of 6.2× and coupled it to a detector with 3.1 µm pixel size and FOV of 5 mm by 3.5 mm (10000 pixels by 7096 pixels). This enabled reconstruction of tomograms with diameter of 5 mm, height of 3.5 mm, and isotropic voxel size of 500 nm. Similar engineering of detectors and objectives might be used for mouse brain connectomics. But for human brain connectomics, one would likely need to focus on constructing a massive detector while maintaining 300 nm pixels to circumvent the probably much greater challenge of developing an objective lens with a FOV in excess of 75 mm. Imaging the entire human brain in less than one year at 27 nm effective voxel size would necessitate either a detector consisting of 62000×62000 300 nm pixels (18.6 mm × 18.6 mm and a tomogram volume of volume of about 5054 mm3)or an even vaster detector with larger pixels coupled to an objective lens with a perhaps unrealistically massive FOV. Projections acquired with such a device would require 97389 projections per tomogram according to Crowther’s limit.12 While this envisioned technology still falls beyond what has previously been achieved even in the case of Yakovlev et al., it is conceivable that current or near-future technology might allow such an objective-detector system to be commissioned for just a few million dollars, particularly given that emerging commercial smartphone cameras can now employ 200 million pixels of 560 nm and similar systems with smaller pixels are under development.20 Effective detector size might also be improved if a smaller detector panel is tiled across a larger light beam (e.g. take four images per projection of a single detector at four different tiled positions). This would linearly increase imaging time but could lead to sizable increases in overall volume acquisition speed. That said, the impact of transition time would need to be considered and might represent a significant issue. It should be noted that camera bandwidth for data recording and transmission, minimizing transition time for moving the sample between tomograms, and the time cost of slightly overlapping tomogram volumes will also need to be considered. Combining a large enough detector system with sufficiently powerful x-ray beam flux per mm2 to achieve 1 millisecond projection acquisition times (as described by the SYNAPSE consortium17), may make a human brain connectome image dataset with 27 nm effective voxel size obtainable in approximately one year of continuous imaging.

Table 1 Comparison of parameters necessary for ExxRM acquisition of a human brain connectome image dataset in 1 year at 27.27 nm effective voxel size with a mouse brain connectome image dataset in 1 month at 27.27 nm effective voxel size.
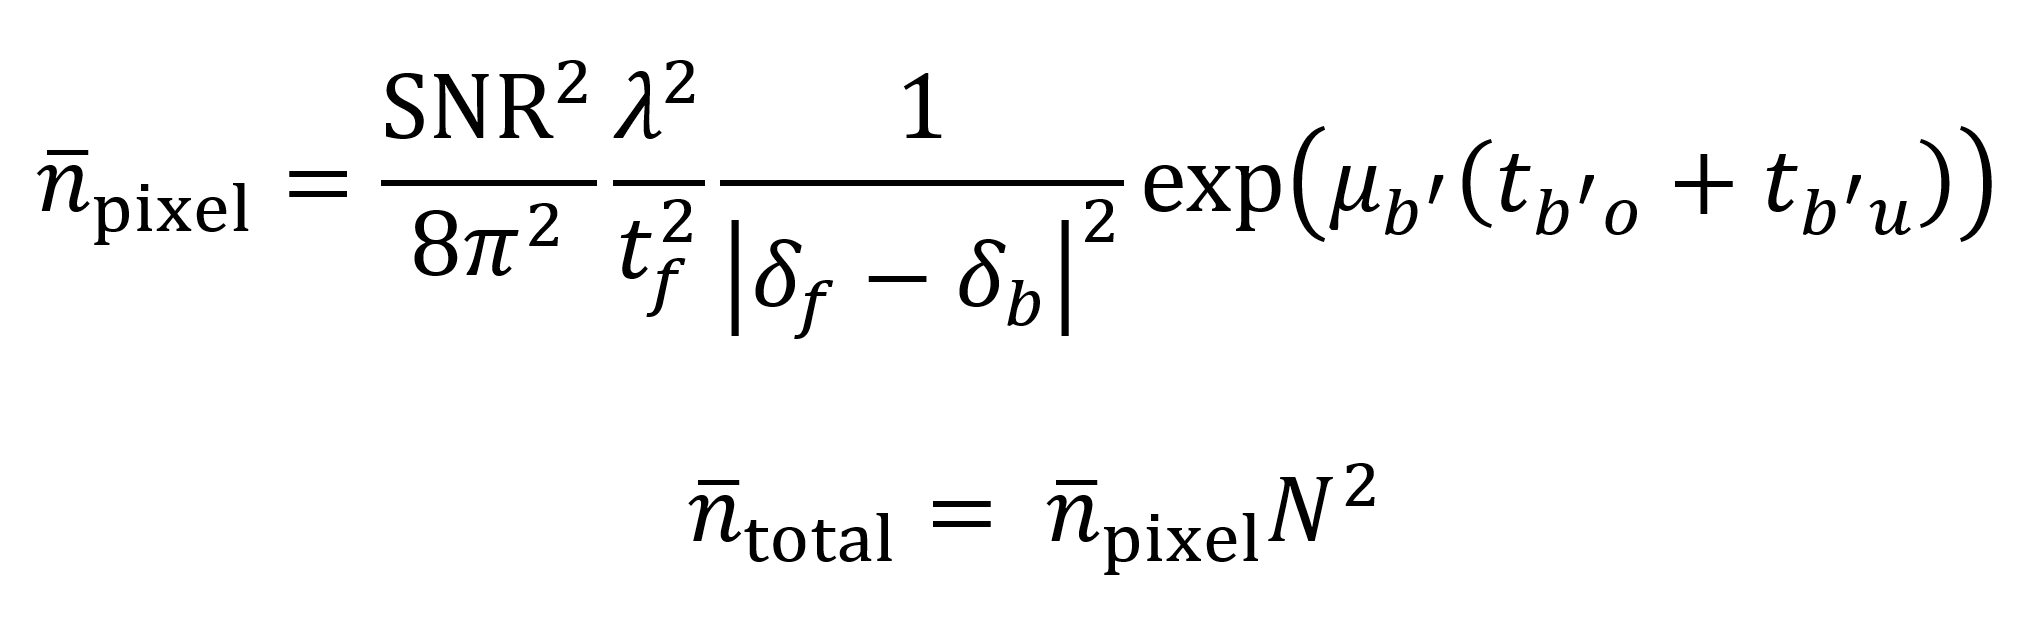
As an additionally useful metric for evaluation, Du et al. offer a mathematical model to estimate the number of photons needed for imaging a sample with sufficient contrast to distinguish between voxels of desired size.12 The model starts by considering how many photons n̄pixel are needed to image a single pixel on a tomographic slice. The pixel is assumed to contain a “feature” material with a phase decrement δf that must be distinguished against a background with a phase decrement δb. Distinctions can be made between adjacent background pixels b, overlaying background pixels bo’ and underlaying background pixels bu’. The SNR is assumed to equal 5 as based on the Rose criterion, which qualitatively represents an acceptable SNR for visually useful images. Background attenuation coefficient is given by µb’ and the thicknesses of the overlaying and underlaying background material are tb’o and tb’u respectively. After the value of n̄pixel is determined, the value is multiplied by the square N2 of the number of pixels N on the detector’s horizontal axis to find the number of photons needed per tomogram. As Du et al. explain, the number of slices is not used as a multiplicative factor since the photons are distributed across all of the rotation angles for each pixel. These calculations act as a guide to what sample properties and beam properties are needed for ExxRM.
The Du et al. model can help determine the feasibility of ExxRM by estimating the necessary flux to image the expanded brain at a desired voxel size in a reasonable time frame. Consider as an example a cube-shaped 0.3 cm3 piece of brain tissue expanded 11-fold to a block with dimensions of 3.3×3.3×3.3 cm. Based on this, assume that the average thickness of overlaying and underlaying background material is 1.65 cm (though the actual value will of course vary with the depth into the sample). Also assume that the background material is made of amorphous water ice with a density of 0.92 g/cm3. By using the Unclearing Microscopy technique, expanded features might be “filled in” after a metallic silver stain.8 Thus, I will assume that the 11-fold expanded features are made up of metallic silver with a density of 5.25 g/cm3, half the density of pure metallic silver (to account for imperfect staining). Feature phase decrements δf, background phase decrements δb, and background attenuation coefficients µb’ across x-ray energies ranging from 10 keV to 30 keV can be obtained using the calculator available at (https://henke.lbl.gov/optical_constants/pert_form.html) which is based on the Henke dataset.21 This calculator does not directly give µb’, but it does give attenuation index β, for which µb’ = 4πβ/λ. According to the resulting model (Supplemental Code File 2), the total number of photons needed to image a single tomogram (volume of 5054 mm3) using the described 18.6 mm × 18.6 mm detector within the given 11-fold expanded block at an energy of 30 keV is about 1×10¹⁴, which is within the capabilities of some contemporary synchrotrons, particularly since the flux per mm2 comes out to roughly 2.89×10¹¹ photons/mm2 after dividing by the area of the detector.
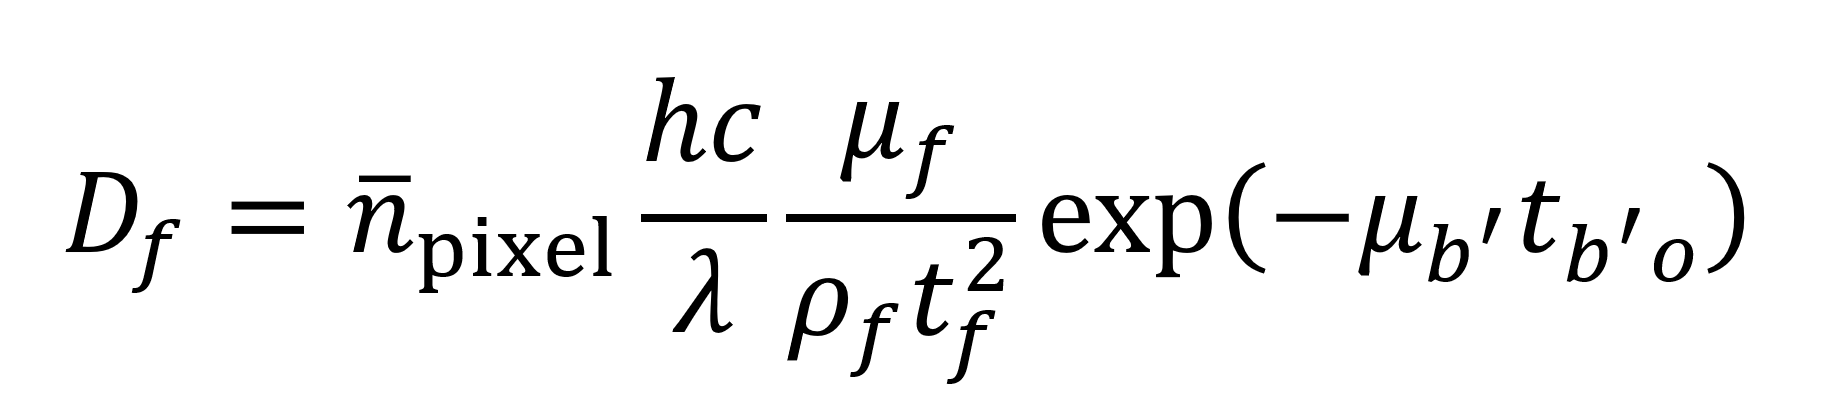
Du et al. also give an equation (see below) for estimating the radiation dose Df imparted to a given feature in units of Gray (Gy) where 1 Gy equals 1 J of energy per kilogram of material. Leveraging the model described above (Supplemental Code File 2), this would give 0.0032 Gy as the dose imparted to a feature or 3.46×10¹¹ Gy per 5054 mm3 tomogram. Though past studies have successfully imaged small specimens subject to comparable doses of radiation,22 this still represents a higher level of exposure than is desirable. As such, the stabilization measures (beyond just keeping the sample at cryogenic temperature during imaging) described earlier might be necessary to maintain sample integrity. Gathering experimental data on tolerable radiation dose for this specific situation will represent a vital step to clarify what engineering approaches are needed to circumvent radiation issues.
Cost estimates for whole brain ExxRM
While the power of the synchrotron facility comes with a high price tag, ExxRM may still represent the most overall cost-effective option for human brain connectomics. Consider the costs associated with the DLS as an illustrative example. The DLS is a third-generation facility and is currently one of the better synchrotrons in terms of its ability to produce bright and coherent x-rays. Building the DLS and its first seven beamlines from 2003-2007 cost about $316M, its later upgrades cost $144M and $134M, and its yearly operational costs have increased from $28M in 2007-2008 to $81M in 2019-2020 (Table 2). Based on these data points, construction of a new synchrotron beamline costs approximately $10M and yearly maintenance may cost roughly $500K. This provides a framework for estimating the cost of a dedicated human brain ExxRM connectomics beamline.

Table 2 Costs associated with the Diamond Light Source23 as a case study on how much money is needed to build and maintain a state-of-the-art synchrotron facility.
Compact Light Source (CLS) technology should be considered as well before continuing. CLS instruments produce x-ray beams that fall somewhere between laboratory x-ray microscopes and synchrotrons in terms of brightness and coherence.24 CLS instruments are furthermore small enough to fit into a single room and are inexpensive enough that a large number of them could potentially be constructed in parallel. At first glance, CLS technology seems a more economically viable alternative to synchrotron beamlines, yet it still probably is not a good option at this time. Existing CLS instruments are not likely suitable for human brain (or even mouse brain) ExxRM connectomics in the foreseeable future because their optical engineering requirements and mediocre level of x-ray flux preclude rapid tomography at submicron resolution, particularly when a large field of view is desired.25 There is a small possibility that future advances in CLS technology could change this situation, yet this seems fairly unlikely, so synchrotron-based imaging remains the best route.
Building an entire synchrotron solely for ExxRM connectomics is probably less efficient than establishing an agreement with an existing synchrotron to construct a connectomics beamline. While one might envision additional parallelization through custom design of the beamline to split the beam to land in multiple sample chambers, splitting the beam would divide the photon flux and therefore increase imaging times for no net gain in speed. As such, parallelization would likely require an additional insertion device and thus an entire new beamline for each new sample chamber. Insertion devices consist of a series of precisely engineered magnets built into straight sections of the synchrotron’s ring. These magnets, known as undulators or wigglers depending on the specifics of the insertion device, stimulate directed emission of a brilliant x-ray beam out from the storage ring.26 Yet even if we assume $10M total plus yearly maintenance costs for each connectomics beamline, imaging multiple human brains over the course of a year or a single human brain in just a few months remains a reasonable proposition. For a project as important as mapping the human brain at sufficient resolution for dense neuronal reconstruction, price tags in the range of tens of millions of dollars may not be out of reach.
Conclusion and outlook
Connectomics needs a technological paradigm shift if it is to feasibilize dense mapping of one or more human brains. Though it comes with some technical challenges, ExxRM may represent a key strategic shift that drastically reduces human brain connectomics timelines from centuries down to 1-2 years for the image acquisition step. Data storage and early processing steps will of course require data centers and high-performance computing, but this field is rapidly advancing and may indeed be capable of handling the challenge. New algorithmic advances and machine learning technologies may help tomographic reconstruction keep pace with imaging data acquisition. Assuming 1 byte per voxel, the amount of storage needed for an 11-fold expanded human brain with 300 nm physical voxel size (27 nm effective voxel size) is about 61 exabytes. Segmentation of the human brain dataset will probably represent a vastly more difficult problem as well as require substantially more compute resources, so further advances in this area will need to occur in parallel with ExxRM development. Realizing the benefits of connectomics in the form of complete computational models of the brain will take additional extensive research. Precisely correlating gene expression and electrophysiological properties with neuronal morphology (i.e. “cell type”) may represent a major step towards bridging the divide between structural data and functional activity. Nonetheless, the allure of having a holistic anatomical picture of the brain may serve as a driving force in the meantime, especially given the clinical implications of this connectome. ExxRM has the potential to transform the dense connectomics field, enabling anatomical imaging of the entire human brain with sub-30 nm voxel size in around a year for a price of roughly $10M.
Supplemental code
Copy and paste each code into a MATLAB script and run, modify as needed:
Supplemental Code 1
% optimization of ExxRM tomographic metrics calculations

% vary detectorpixels_on_a_side
detectorpixels_on_a_side = 62000; %[62000 human; 4334 mouse]; % assume that large detectors and big beams are possible
dponas = detectorpixels_on_a_side; % square detector pixels on a side, see above
pixelsize = 300; % nm; assume this size can be achieved
squaredetectorsize_on_a_side_mm = dponas.*(pixelsize*10^-6);
npixels_slice = dponas.^2; % total number of pixels on n x n detector
projections = dponas*(pi/2); % based on Du et al. equation 7, Crowther's limit

% vary pixelsize, expansionfactor
singleprojectiontime = 0.001; % seconds; very fast, as seen in https://doi.org/10.1016/j.physrep.2022.11.003 and https://doi.org/10.1107/S1600577521007633
expansionfactor = 11; % vary with [4; 4.5; 8; 10; 11; 16; 20; 25]

% effectivepixelsize should be 30 nm or less
effectivepixelsize = pixelsize/expansionfactor % effective pixel size post-expansion

tomogramvolume_voxels = dponas.*pi.*(dponas./2).^2; % cylindrical tomogram volume in number of voxels
tomogramvolume_mm3 = tomogramvolume_voxels*(pixelsize^3)/(10^18); % cylindrical tomogram volume in mm3
tomogramtimeseconds = singleprojectiontime*projections % time per tomogram

humanbrainvolume = 1200*1000; % mm^3
mousebrainvolume = 500; % mm^3

% human brain calculations
expandedhumanbrainvolume = humanbrainvolume*(expansionfactor^3); % mm^3
totaltomograms_humanbrain = expandedhumanbrainvolume./tomogramvolume_mm3; % number of tomograms needed for whole expanded human brain
totalimagingtimeseconds_humanbrain = totaltomograms_humanbrain.*tomogramtimeseconds; % seconds
secondsperyear = 3.154*10^7; % number of seconds in a year
totalimagingtimeyears_humanbrain = totalimagingtimeseconds_humanbrain/secondsperyear; % years
format longG;
totalimagingtimeyearshumanbrain_squaredetectorsizeonsidemm = [totalimagingtimeyears_humanbrain, squaredetectorsize_on_a_side_mm]

% mouse brain calculations
expandedmousebrainvolume = mousebrainvolume*(expansionfactor^3); % mm^3
totaltomograms_mousebrain = expandedmousebrainvolume./tomogramvolume_mm3; % number of tomograms needed for whole expanded human brain
totalimagingtimeseconds_mousebrain = totaltomograms_mousebrain.*tomogramtimeseconds; % seconds
totalimagingtimeyears_mousebrain = totalimagingtimeseconds_mousebrain/secondsperyear; % years
format longG;
totalimagingtimeyearsmousebrain_squaredetectorsizeonsidemm = [totalimagingtimeyears_mousebrain, squaredetectorsize_on_a_side_mm]
Supplemental Code 2
% calculations of photon flux for ExxRM

%expansion x-ray microscopy radiation dose calculations based on Du et al. at 30 keV energy for silver at 5.25 g cm^-3
rhof_percm3 = 5.25; % g/cm^3 or use 10.49 g/cm^3 for 'silver_constants.mat'
rhof = rhof_percm3./(10^21); % density in g/nm^3
venergy = 2.9672*10^4; % source is calculator (Ag 5.25 g cm^-3) at https://henke.lbl.gov/optical_constants/getdb2.html
vdelta = 1.0086*10^-6; % source is calculator (Ag 5.25 g cm^-3) at https://henke.lbl.gov/optical_constants/getdb2.html
vbeta = 6.1419*10^-8; % source is calculator (Ag 5.25 g cm^-3) https://henke.lbl.gov/optical_constants/getdb2.html
venergybackground = 2.9672*10^4; % source is calculator (H2O 0.92 g cm^-3) at https://henke.lbl.gov/optical_constants/getdb2.html
vdeltabackground = 2.4086*10^-7; % source is calculator (H2O 0.92 g cm^-3) at https://henke.lbl.gov/optical_constants/getdb2.html
vbetabackground = 1.0051*10^-10; % source is calculator (H2O 0.92 g cm^-3) at https://henke.lbl.gov/optical_constants/getdb2.html
snr = 5; % desired signal-to-noise ratio, value of 5 is Rose criterion
E = venergy; % energy range in eV
hc = 1239; % Plank's constant times the speed of light in units of eV nm
lamda = hc*(E.^-1); % x-ray wavelength at energy E
tf = 300; % feature thickness with expansion (nanometers)
deltaf = vdelta; % phase shift of feature composed of silver
deltab = vdeltabackground; % phase shift of background composed of amorphous ice with density 0.92 g cm^-3
betaf = vbeta; % absorption index of feature composed of silver
betab = vbetabackground; % absorption index of background composed of amorphous ice with density 0.92 g cm^-3
mupb = 4*pi.*betab./lamda; % mu'b, attenuation coefficient (nm^-1) of background over and under feature (not adjacent)
mub = 4*pi.*betab./lamda; % mub, attenuation coefficient (nm^-1) of background adjacent to feature
muf = 4*pi.*betaf./lamda; % mub, attenuation coefficient (nm^-1) of feature
tbo = 16500000; % average thickness of background over feature (nm), assuming 0.3 cm^3 block 11x expanded to 3.3 cm side length
tbu = 16500000; % average thickness of background under feature (nm), assuming 0.3 cm^3 block 11x expanded to 3.3 cm side length

% primary useful x-ray properties calculator https://henke.lbl.gov/optical_constants/getdb2.html
% another useful x-ray properties calculator http://purple.iptm.ru/xcalc/xcalc_mysql/ref_index.php

npixel_phase = ((snr^2)/(8*pi^2)).*((lamda.^2)./(tf.^2)).*(((abs(deltaf-deltab)).^-2)).*exp(mupb.*(tbo+tbu));
% photons per pixel needed for phase contrast imaging of a feature f

npixel_absorption = ((snr^2)/(8*pi^2)).*((lamda.^2)./(tf.^2)).*(((abs(betaf-betab)).^-2)).*exp(mupb.*(tbo+tbu));
% photons per pixel needed for absorption imaging of a feature f

square_detector_side_pixels_mm = 62000; % assume 300 nm pixel size on a 18.6 mm by 18.6 mm detector
npixels_tomo = npixel_phase*square_detector_side_pixels_mm^2; % Du et al. equation 8 gives total photons per tomogram
slices = square_detector_side_pixels_mm*(pi/2); % estimated number of slices required for tomographic reconstruction, given by N pixels on side length times pi/2

% Note: not every pixel contains a feature, but for now, we will assume that this is not the case
featuredensity = 1;
photons_tomo = featuredensity*npixels_tomo % total photons needed to image a tomogram in this situation

radiation_dose_npixelDf = npixel_phase.*(hc./lamda).*(muf./(rhof.*(tf.^2))).*exp(-mupb*tbo); % units of eV/g
C = (1.60218*10^-19)/1000% Multiplicative factor C to convert eV/g to J/kg
Df = C*radiation_dose_npixelDf % radiation dose in Gray (Gy) imparted to each feature. Multiplicative factor C converts eV/g to J/kg
Dftomo = photons_tomo.*Df
References
1. Collins, L. T. The case for emulating insect brains using anatomical “wiring diagrams” equipped with biophysical models of neuronal activity. Biol. Cybern. 113, 465–474 (2019).
2. Koene, R. A. Fundamentals of whole brain emulation: state, transition, and update representations. Int. J. Mach. Conscious. 04, 5–21 (2012).
3. Yin, W. et al. A petascale automated imaging pipeline for mapping neuronal circuits with high-throughput transmission electron microscopy. Nat. Commun. 11, 4949 (2020).
4. Badea, A., Ali-Sharief, A. A. & Johnson, G. A. Morphometric analysis of the C57BL/6J mouse brain. Neuroimage 37, 683–693 (2007).
5. Cosgrove, K. P., Mazure, C. M. & Staley, J. K. Evolving Knowledge of Sex Differences in Brain Structure, Function, and Chemistry. Biol. Psychiatry 62, 847–855 (2007).
6. Lillvis, J. L. et al. Rapid reconstruction of neural circuits using tissue expansion and light sheet microscopy. Elife 11, e81248 (2022).
7. Watkins, S. C. & St. Croix, C. M. Light sheet imaging comes of age. J. Cell Biol. 217, 1567–1569 (2018).
8. M’Saad, O., Shribak, M. & Bewersdorf, J. Unclearing Microscopy. bioRxiv 2022.11.29.518361 (2022) doi:10.1101/2022.11.29.518361.
9. R A Lewis. Medical phase contrast x-ray imaging: current status and future prospects. Phys. Med. Biol. 49, 3573 (2004).
10. Klimas, A. et al. Magnify is a universal molecular anchoring strategy for expansion microscopy. Nat. Biotechnol. (2023) doi:10.1038/s41587-022-01546-1.
11. M’Saad, O. & Bewersdorf, J. Light microscopy of proteins in their ultrastructural context. Nat. Commun. 11, 3850 (2020).
12. Du, M. et al. Upscaling X-ray nanoimaging to macroscopic specimens. J. Appl. Crystallogr. 54, 386–401 (2021).
13. Matsuyama, S. et al. Elemental mapping of frozen-hydrated cells with cryo-scanning X-ray fluorescence microscopy. X-Ray Spectrom. 39, 260–266 (2010).
14. Lombi, E. et al. Fast X-Ray Fluorescence Microtomography of Hydrated Biological Samples. PLoS One 6, e20626 (2011).
15. Depannemaecker, D. et al. Gold Nanoparticles for X-ray Microtomography of Neurons. ACS Chem. Neurosci. 10, 3404–3408 (2019).
16. Logan Thrasher Collins, Kayla Siletti, Kristine Fischenich, Jennifer Coulombe, Nathan Anderson, M. S. Structural brain mapping using antibody-conjugated gold nanoparticles and x-ray microscopy. in Society for Neuroscience Conference (2019).
17. Stampfl, A. P. J. et al. SYNAPSE: An international roadmap to large brain imaging. Phys. Rep. 999, 1–60 (2023).
18. Chen, H. H. et al. High-resolution fast-tomography brain-imaging beamline at the Taiwan Photon Source. J. Synchrotron Radiat. 28, 1662–1668 (2021).
19. Yakovlev, M. A. et al. A wide-field micro-computed tomography detector: micron resolution at half-centimetre scale. J. Synchrotron Radiat. 29, 505–514 (2022).
20. Moore, S. K. Samsung and Omnivision Claim Smallest Camera Pixels. IEEE Spectrum https://spectrum.ieee.org/cmos-image-sensor-pixel (2022).
21. Henke, B. L., Gullikson, E. M. & Davis, J. C. X-Ray Interactions: Photoabsorption, Scattering, Transmission, and Reflection at E = 50-30,000 eV, Z = 1-92. At. Data Nucl. Data Tables 54, 181–342 (1993).
22. Tennant, D. Soft X-ray microscopy with a cryo scanning transmission X-ray microscope: I. Instrumentation, imaging and spectroscopy. J. Microsc. 197, 68–79 (2000).
23. Diamond Light Source About Us. https://www.diamond.ac.uk/Home/About/ (2022).
24. Gradl, R. et al. Propagation-based Phase-Contrast X-ray Imaging at a Compact Light Source. Sci. Rep. 7, 4908 (2017).
25. Gunther, B. et al. The versatile X-ray beamline of the Munich Compact Light Source: design, instrumentation and applications. J. Synchrotron Radiat. 27, 1395–1414 (2020).
26. Willmott, P. Synchrotron Physics. in An Introduction to Synchrotron Radiation 39–86 (2011). doi:https://doi.org/10.1002/9781119970958.ch3.